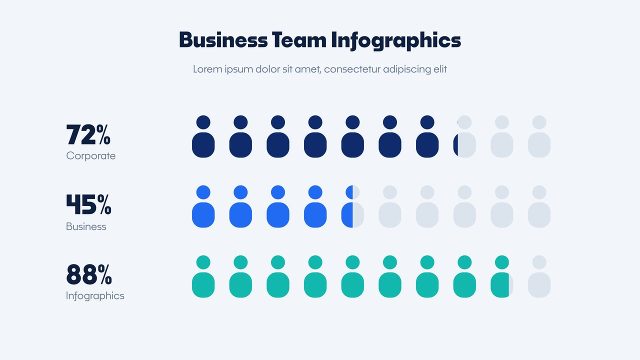
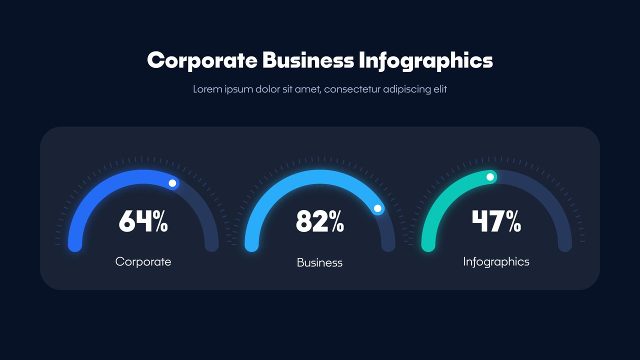
Animated Year Comparison Bar Chart Infographics for Corporate Data After Effects Template
Animated Year Comparison Bar Chart Infographics for Corporate Data: After Effects infographic template with comparison bars, counting values, 60 fps. Full HD.
Attributes
- Application After Effects
- Version After Effects 2023 or later
- Resolution Horizontal · Resizable
- File size 0.14 MB
- Fonts Noka · Changeable
- Required plugins None
- Tutorial PDF included
- Video guide How to use After Effects templates
- License Commercial use
About this template
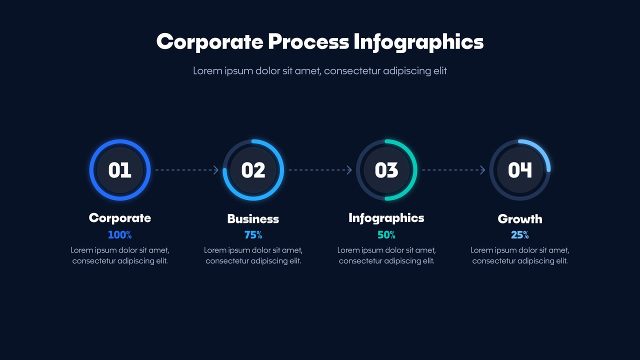
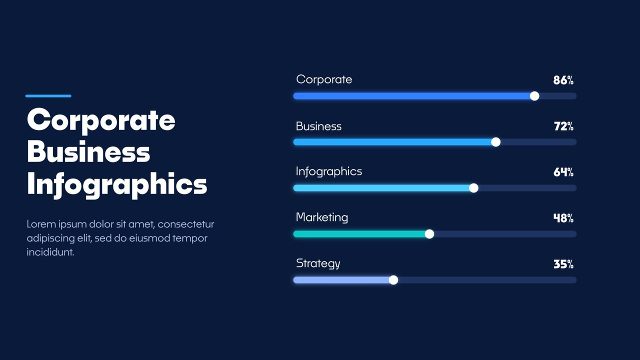
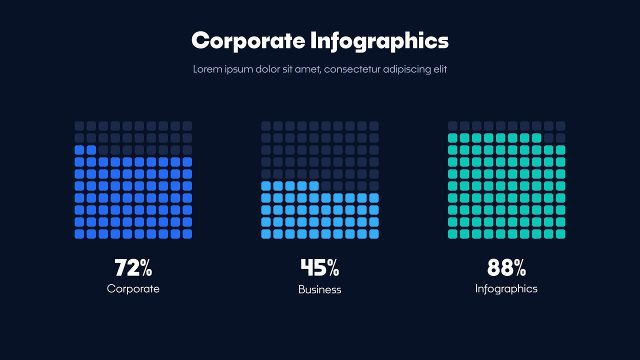
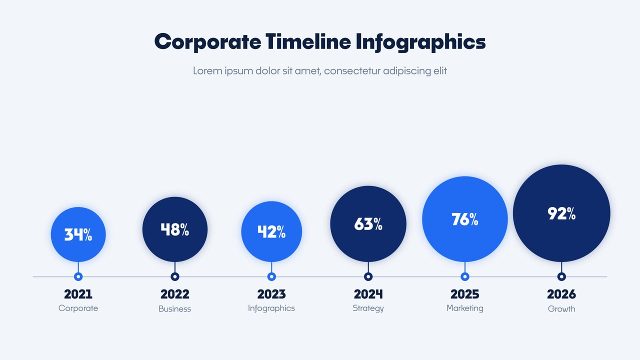
Animated Year Comparison Bar Chart Infographics for Corporate Data is a data visualization template for After Effects. Pairs of bars grow left and right from six centre labels, comparing two years in blue and green with counting values at the ends of the bars. Smooth easing and counting numbers make the comparison bars feel alive without being busy. Use these business infographics for HR and team updates, social media posts, corporate videos and product launches. The rounded Noka typeface (Adobe Fonts, free with Creative Cloud) matches the soft shapes of the comparison bars.
The animation runs about 9 seconds: the title and the comparison bars build in, the values count up and everything holds on screen. The CONTROL PANEL layer gives you value sliders, on/off switches for each item and colour pickers for the comparison bars; the texts sit in the EDIT comp. Full HD at 60 fps and resizable, it opens in After Effects 2023 and newer using only built-in tools. Swap the numbers for your own figures and the comparison bars redraw instantly.