Animated Bubble Scatter Plot Infographics for Business Data Analysis After Effects Template
Animated Bubble Scatter Plot Infographics for Business Data Analysis: After Effects infographic template with scatter plot, editable values and colours, 60 fps.
Attributes
- Application After Effects
- Version After Effects 2023 or later
- Resolution Horizontal · Resizable
- File size 0.15 MB
- Fonts Noka · Changeable
- Required plugins None
- Tutorial PDF included
- Video guide How to use After Effects templates
- License Commercial use
About this template
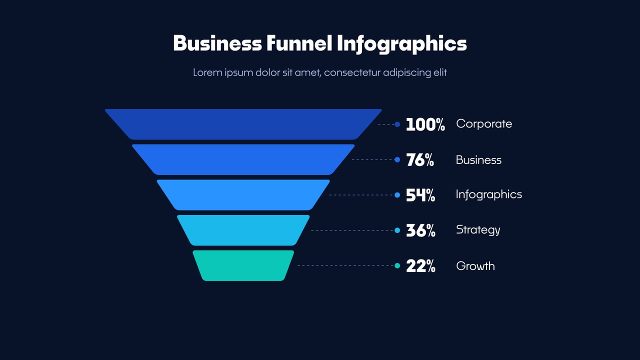
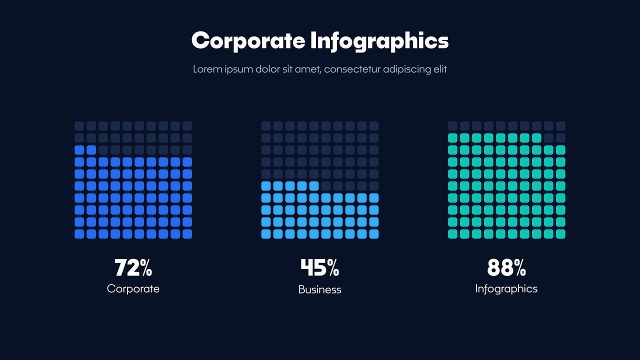
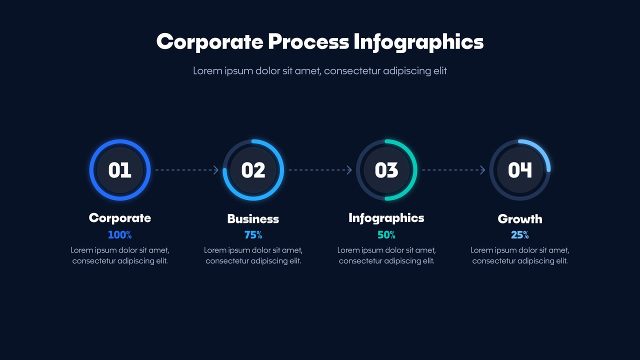
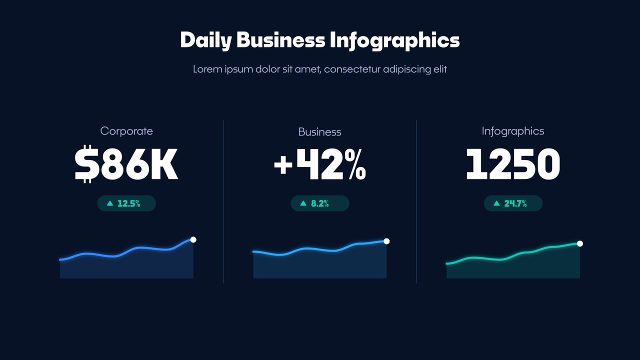
Animated Bubble Scatter Plot Infographics for Business Data Analysis is a data visualization template for After Effects. Seven bubbles in three colour groups pop onto an X and Y grid with axis titles and values, each bubble showing its own number, under a title and legend. Smooth easing and counting numbers make the scatter plot feel alive without being busy. Use these business infographics for investor pitches, annual reports, corporate videos and finance videos. The title, labels and numbers use Noka, an Adobe Fonts family that comes with Creative Cloud.
Within 9 seconds the title lands, the scatter plot build and the numbers settle on their values. All numbers are sliders on the CONTROL PANEL layer, so the scatter plot update automatically; texts are edited in the EDIT comp. This After Effects 2023+ project runs at 60 fps in Full HD and keeps the scatter plot sharp at any size. Turn items off when you have fewer data points; the layout stays balanced.