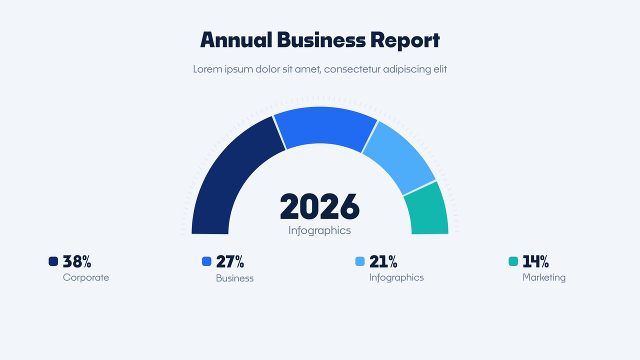
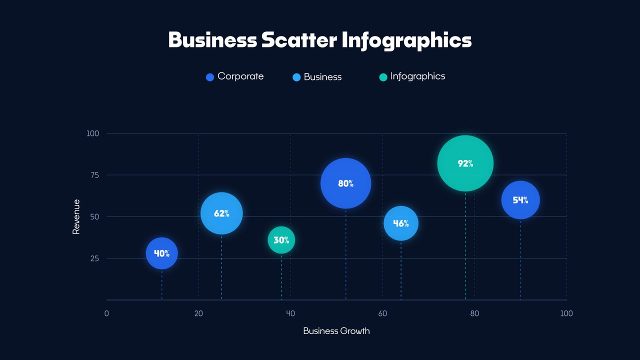
Animated KPI Statistics Infographics with Sparkline Charts for Daily Business After Effects Template
Animated KPI Statistics Infographics with Sparkline Charts for Daily Business: After Effects infographic template with KPI numbers, counting values, 60 fps.
Attributes
- Application After Effects
- Version After Effects 2023 or later
- Resolution Horizontal · Resizable
- File size 0.13 MB
- Fonts Noka · Changeable
- Required plugins None
- Tutorial PDF included
- Video guide How to use After Effects templates
- License Commercial use
About this template
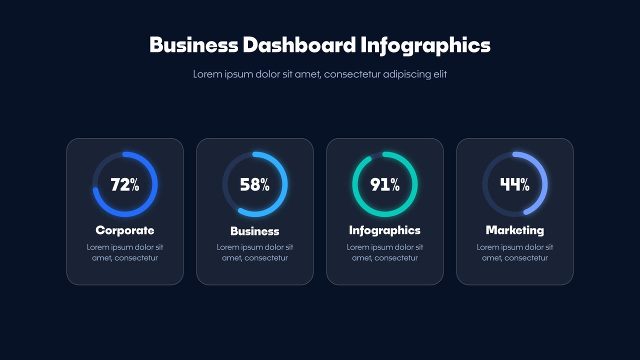
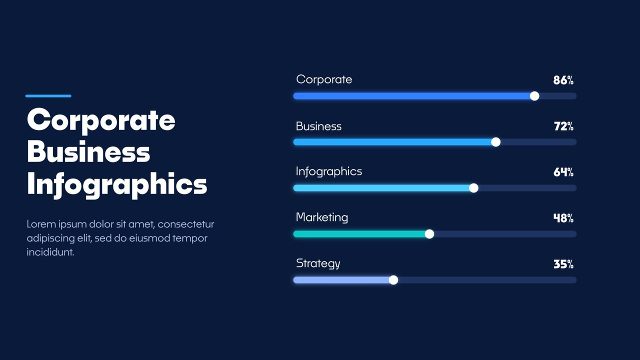
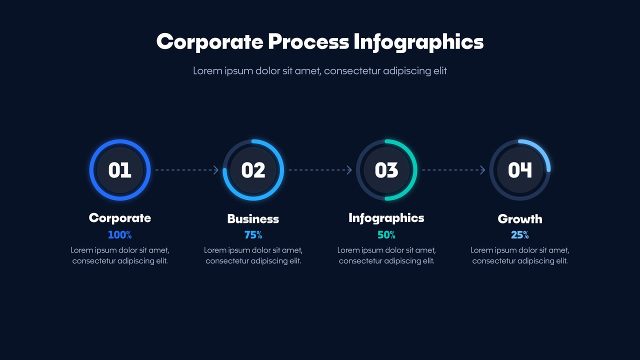
Animated KPI Statistics Infographics with Sparkline Charts for Daily Business is an animated business chart for After Effects. Three big counting numbers with labels and small change badges sit in three columns, each with its own mini line chart that draws underneath. Smooth easing and counting numbers make the KPI numbers feel alive without being busy. Use these business infographics for business presentations, investor pitches, finance videos and monthly reviews. Only one font is needed, Noka from Adobe Fonts, for the title, labels and values.
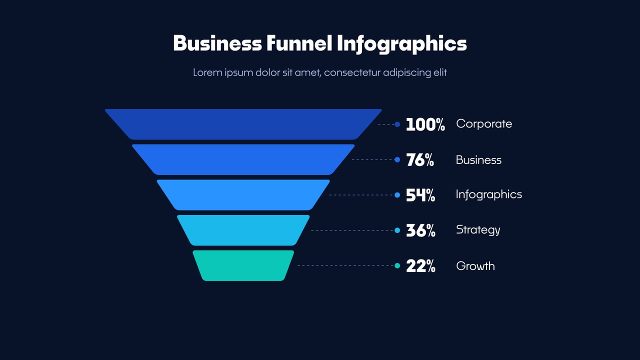
After about 9 seconds of animation, the KPI numbers hold still so you can keep them on screen as long as you like. Change a value slider on the CONTROL PANEL layer and the KPI numbers redraw to match, with the labels and title edited in the EDIT comp. It is a 1920x1080, 60 fps project, resizable, for After Effects 2023 or later, with no third-party plugins. Pair it with the other charts in this infographics pack for a consistent report video.