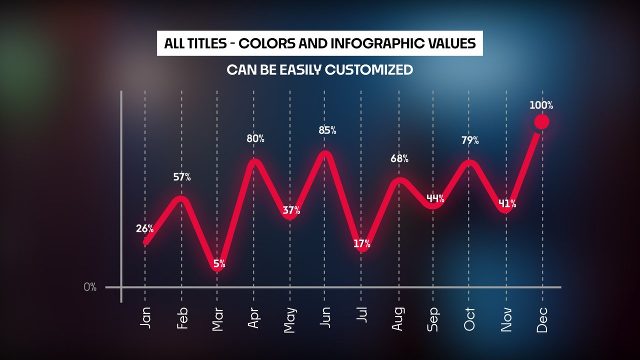
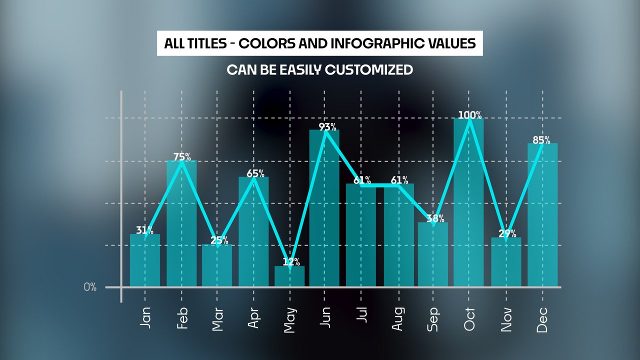
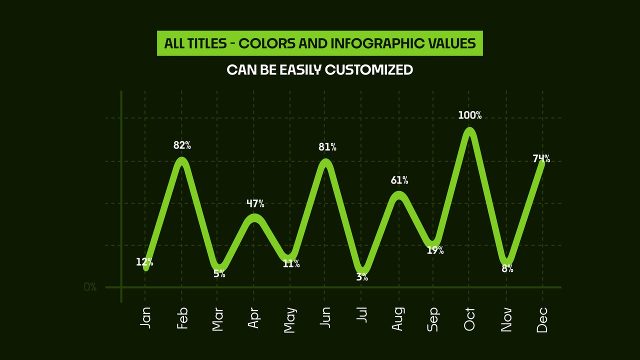
Animated Daily Infographics Comparison with Monthly Data Analytics Video Template for After Effects
Animated Daily Infographics Comparison with Monthly Data Analytics: After Effects infographic template, editable text and colors, 60 fps. Premium.
Attributes
- Application After Effects
- Version After Effects 2023 or later
- Resolution Horizontal · Resizable
- File size 0.19 MB
- Fonts Noka (Adobe Fonts)
- Required plugins None
- Tutorial PDF included
- License Commercial use
About this template
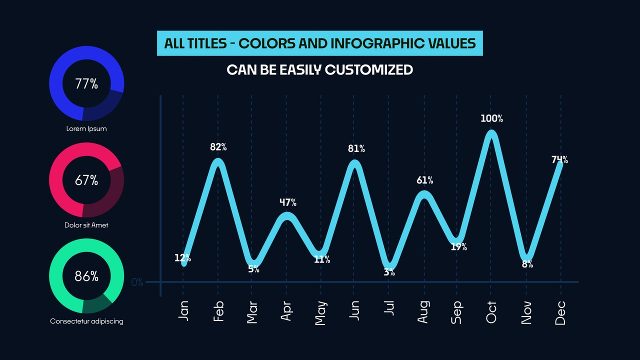
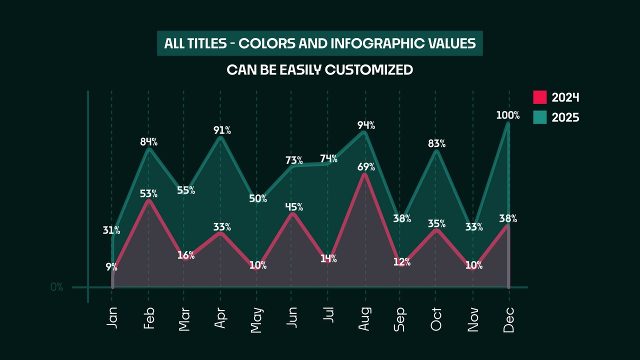
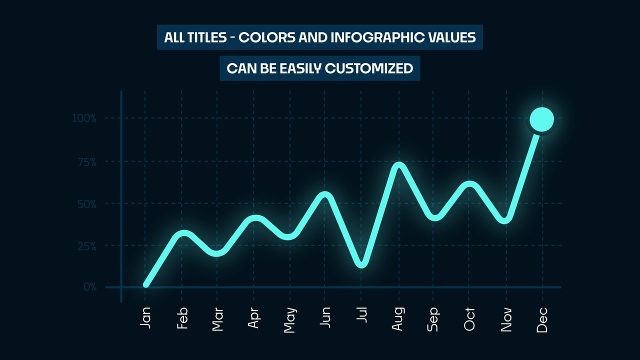
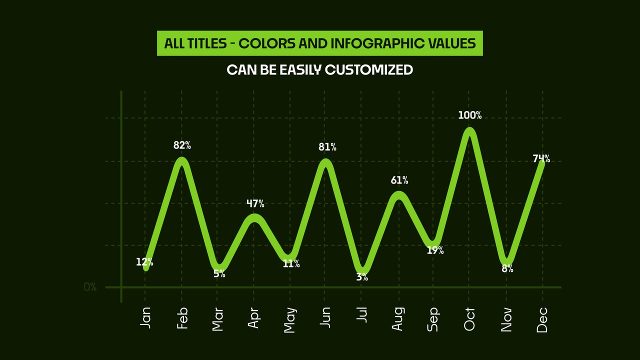
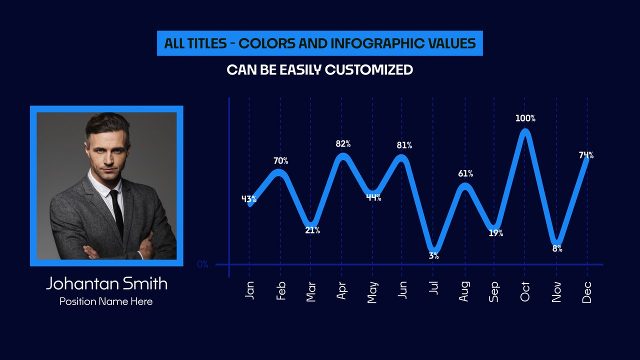
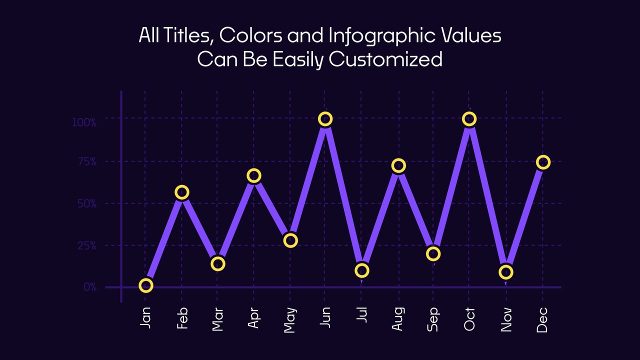
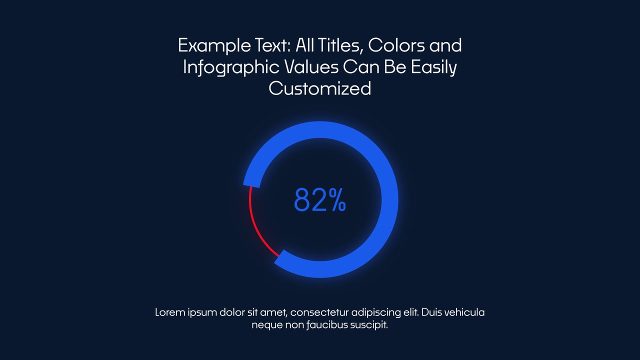
On screen you get a daily infographics comparison with monthly data analytics. Enter your own data and the animated charts adjust on their own, from a weekly snapshot to monthly and annual reports. It is especially handy for daily data: day by day values build a clear 30 day picture. Modern and smooth, this statistics template combines percent counters with a dashboard style layout. It uses Noka from Adobe Fonts, which every Creative Cloud member can activate for free. Typical uses: investor pitches, webinars, corporate meetings and marketing reports.
Specs: After Effects 2023 or later, 60 fps, 14 seconds, dozens of editable text and value fields and 8 color controls, horizontal, resizable. Everything sits on one control panel, so you never dig through nested comps. Toggle the background layer on or off: use it as a standalone card or as an overlay on your video. The demo media behind it is only for the preview. Like all our premium video templates, it is built to be edited fast; browse more infographic templates to build a full set.