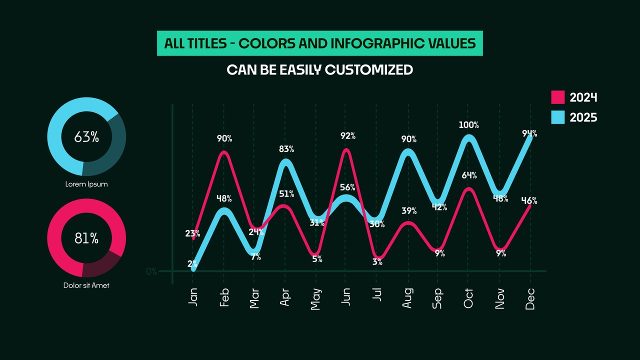
Daily Data Comparison Infographics Animation with Line Graphs After Effects Project
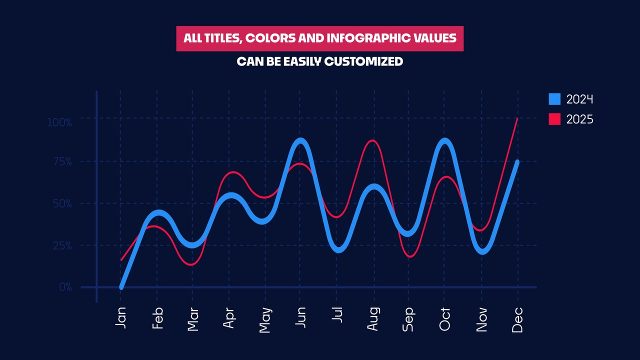
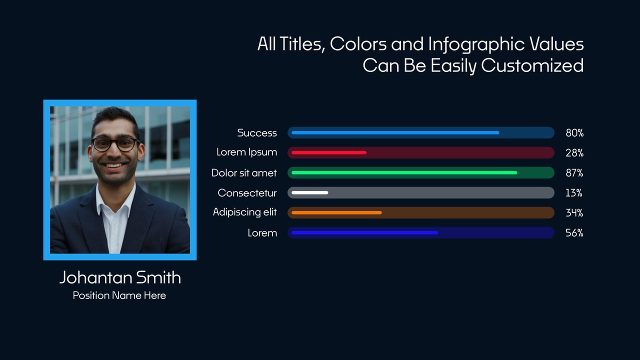
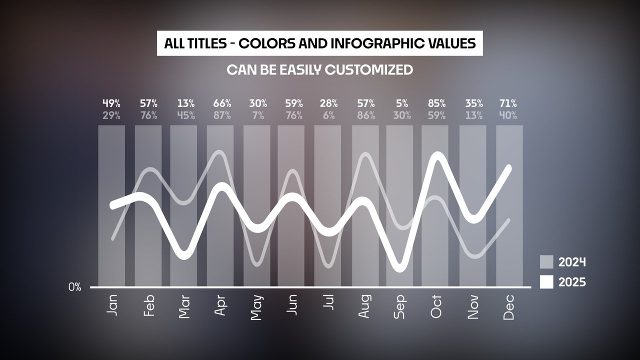
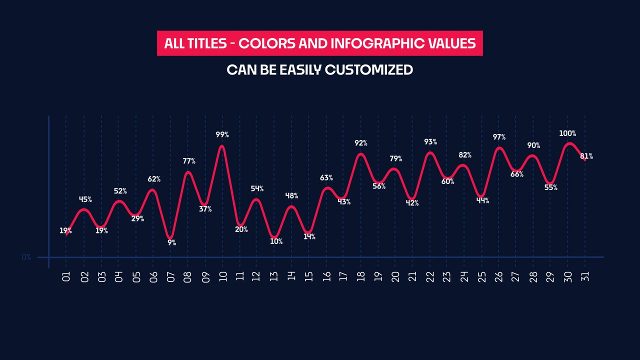
Daily Data Comparison Infographics Animation with Line Graphs: After Effects infographic template, editable text and colors, 60 fps. Premium.
Attributes
- Application After Effects
- Version After Effects 2023 or later
- Resolution Horizontal · Resizable
- File size 0.19 MB
- Fonts Noka (Adobe Fonts)
- Required plugins None
- Tutorial PDF included
- License Commercial use
About this template
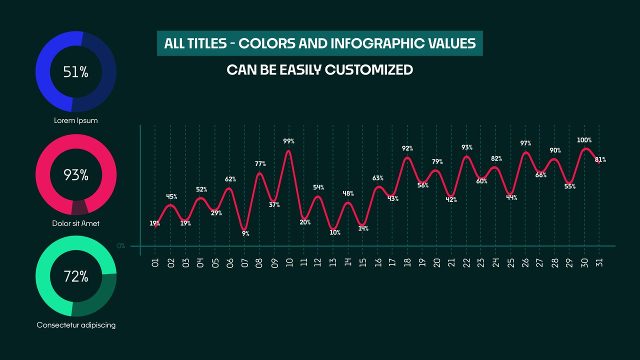
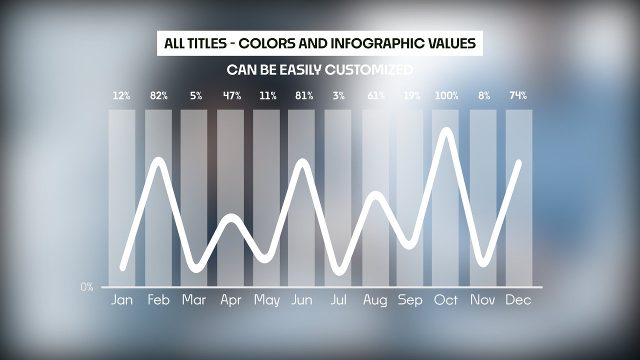
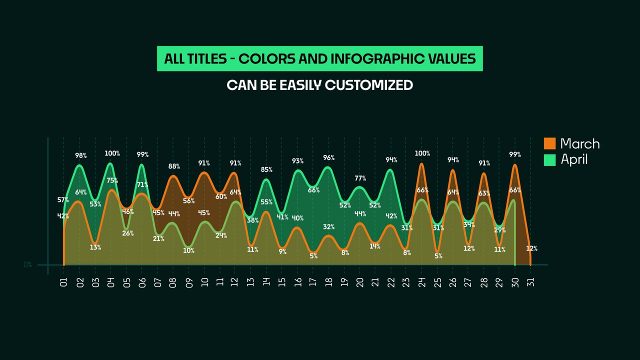
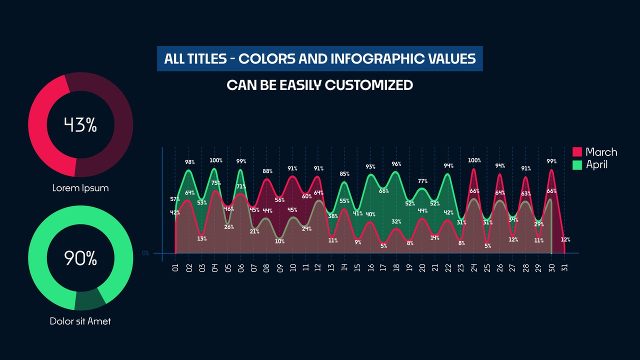
The infographic is built on daily data comparison infographics with line graphs. Swap in your own statistics and the chart animation follows, ready for daily updates, monthly reports or a yearly review. It is especially handy for daily data: day by day values build a clear 30 day picture. A good match for quarterly reviews, KPI dashboards and monthly reports. It reads as a sleek, minimal data visualization thanks to editable values and motion graphics. Typography: Noka, activated in one click through Adobe Fonts.
Edit dozens of editable text and value fields and 11 color controls from one control panel plus scale and position controls. Length: 22 seconds at 60 fps, horizontal, resizable. Timing is easy to stretch, so the hold can match your voiceover. The built-in background color is editable and can be turned off for overlay use. The demo media behind it is only for the preview. Drop this video template into any project, then add more infographic templates for a consistent series.