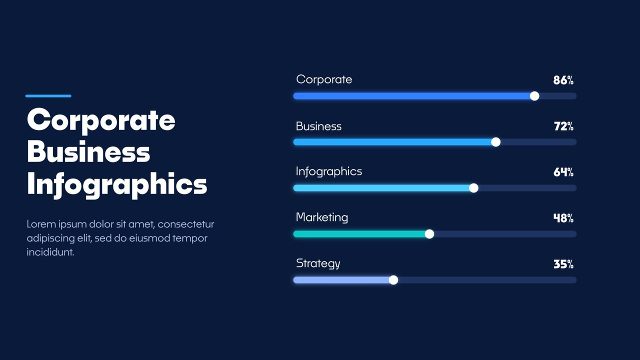
Animated Donut Chart Infographics for Annual Business Reports After Effects Template
Animated Donut Chart Infographics for Annual Business Reports: After Effects infographic template with donut chart, editable values and colours, 60 fps.
Attributes
- Application After Effects
- Version After Effects 2023 or later
- Resolution Horizontal · Resizable
- File size 0.14 MB
- Fonts Noka · Changeable
- Required plugins None
- Tutorial PDF included
- Video guide How to use After Effects templates
- License Commercial use
About this template
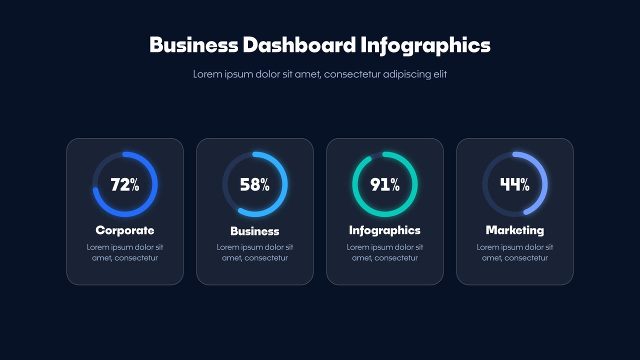
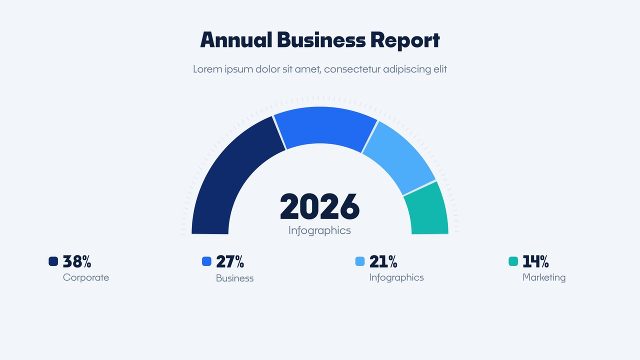
Animated Donut Chart Infographics for Annual Business Reports is an animated business chart for After Effects. A donut chart with four segments draws around a big centre year, while a legend with coloured markers, labels, lines and counting percentages builds on the right under a clean title. It is a modern, minimal data visualization where the donut chart carry the story. Use these business infographics for annual reports, product launches, business presentations and HR and team updates. Noka from Adobe Fonts keeps the numbers on the donut chart clear even at small sizes.
The build-in of the donut chart takes about 9 seconds, ending on the final values. In After Effects you type the title, subtitle and labels in the EDIT comp, and the CONTROL PANEL layer holds every value slider, the on/off switches and all colours for the donut chart. Works in After Effects 2023 and later; the layout is 1920x1080, 60 fps and resizable. Swap the numbers for your own figures and the donut chart redraw instantly.