Animated Stacked Column Chart Infographics for Annual Business Data After Effects Template
Animated Stacked Column Chart Infographics for Annual Business Data: After Effects infographic template with column chart, editable values and colours, 60 fps.
Attributes
- Application After Effects
- Version After Effects 2023 or later
- Resolution Horizontal · Resizable
- File size 0.14 MB
- Fonts Noka · Changeable
- Required plugins None
- Tutorial PDF included
- Video guide How to use After Effects templates
- License Commercial use
About this template
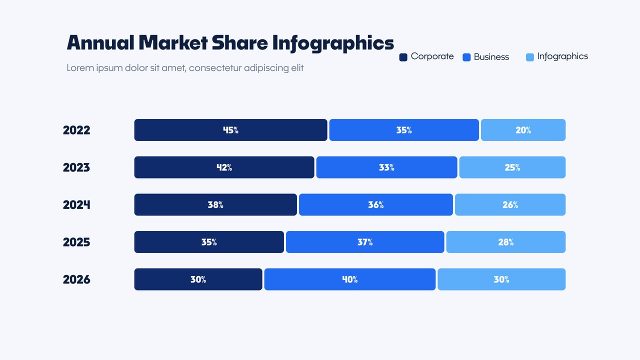
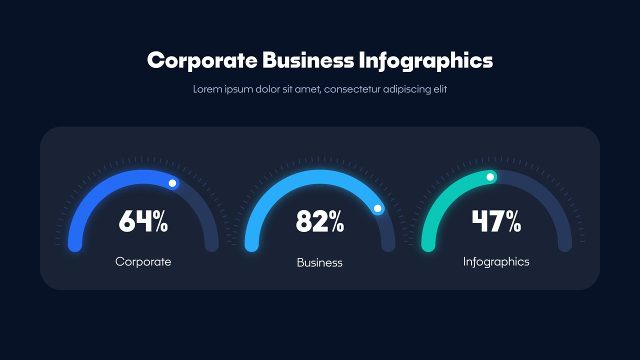
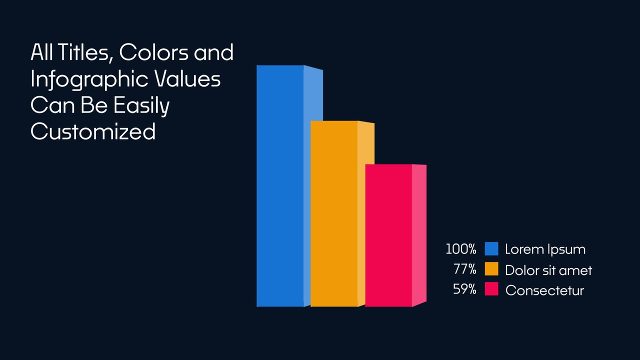
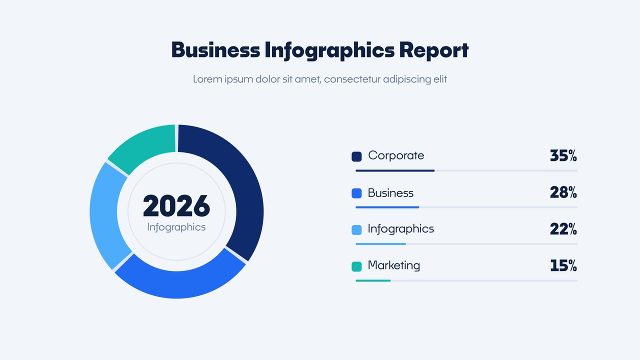
Animated Stacked Column Chart Infographics for Annual Business Data is a data visualization template for After Effects. Seven stacked columns with three colour series grow year by year on a light grid, totals appear on top of each column and a legend sits next to the title. It is a modern, minimal data visualization where the column chart carry the story. Use these business infographics for startup decks, marketing reports, monthly reviews and news segments. The rounded Noka typeface (Adobe Fonts, free with Creative Cloud) matches the soft shapes of the column chart.
After about 9 seconds of animation, the column chart hold still so you can keep them on screen as long as you like. The CONTROL PANEL layer gives you value sliders, on/off switches for each item and colour pickers for the column chart; the texts sit in the EDIT comp. Full HD at 60 fps and resizable, it opens in After Effects 2023 and newer using only built-in tools. Turn items off when you have fewer data points; the layout stays balanced.