Corporate Big Number Dashboard Infographic Animation with Mini Line Charts Premiere Pro MOGRT
Corporate Big Number Dashboard Infographic Animation with Mini Line Charts: Premiere Pro infographic template with KPI numbers, counting values, 60 fps.
Attributes
- Application Premiere Pro
- Version Premiere Pro 2023 or later
- Resolution Horizontal · Resizable
- File size 0.17 MB
- Fonts Noka · Changeable
- Required plugins None
- Tutorial PDF included
- Video guide How to use MOGRT in Premiere Pro
- License Commercial use
About this template
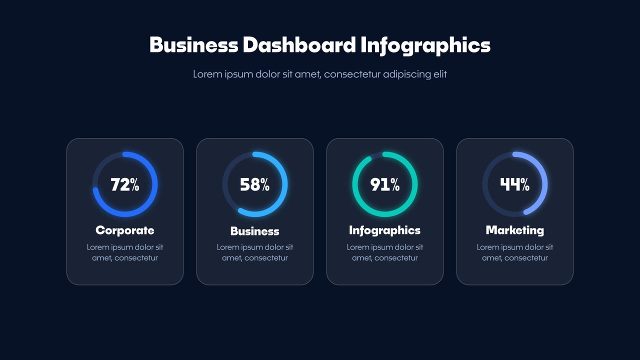
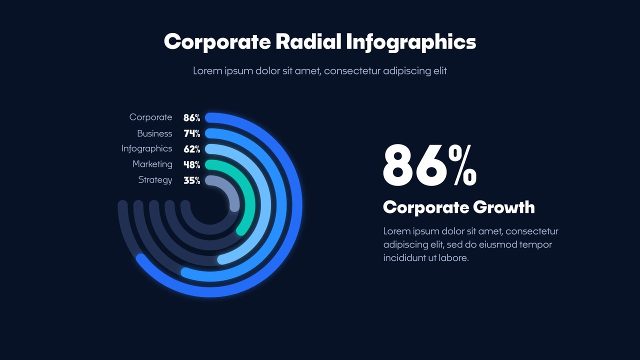
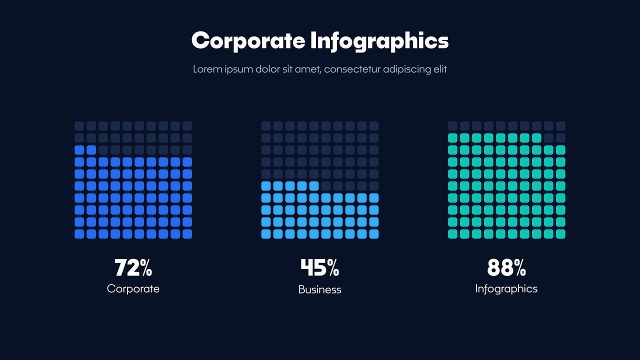
Corporate Big Number Dashboard Infographic Animation with Mini Line Charts is a data visualization template for Premiere Pro. Big counters with mini line charts give this Premiere Pro infographic a modern dashboard feel for revenue, users and daily KPIs. Every colour, including the KPI numbers, can be changed to match your corporate brand. Use these business infographics for startup decks, monthly reviews, product launches and investor pitches. Noka from Adobe Fonts sets the title next to the KPI numbers, plus every label and number.
The build-in of the KPI numbers takes about 9 seconds, ending on the final values. In Premiere Pro, Properties > Templates gives you Global Scale and Position, the title and subtitle, a value and label for 3 items, 3 on/off switches, 8 colour controls and a background on/off switch. It is a 1920x1080, 60 fps MOGRT, resizable, for Premiere Pro 2023 or later; After Effects is not needed. Because the KPI numbers are fully vector, they stay sharp in 4K timelines too.