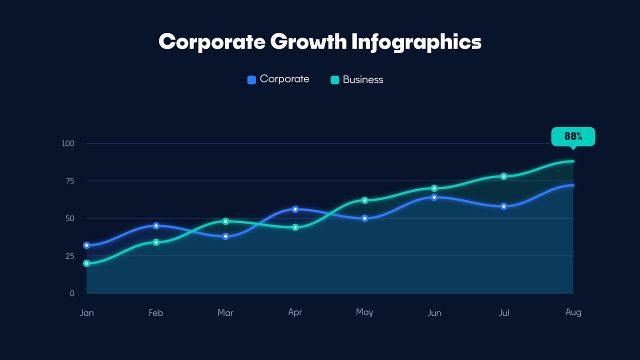
Corporate Year by Year Bar Chart Infographic Animation with Three Series Premiere Pro MOGRT
Corporate Year by Year Bar Chart Infographic Animation with Three Series: Premiere Pro infographic template with column chart, counting values, 60 fps.
Attributes
- Application Premiere Pro
- Version Premiere Pro 2023 or later
- Resolution Horizontal · Resizable
- File size 0.17 MB
- Fonts Noka · Changeable
- Required plugins None
- Tutorial PDF included
- Video guide How to use MOGRT in Premiere Pro
- License Commercial use
About this template
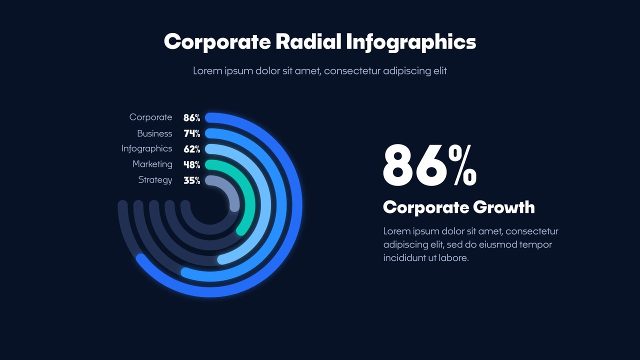
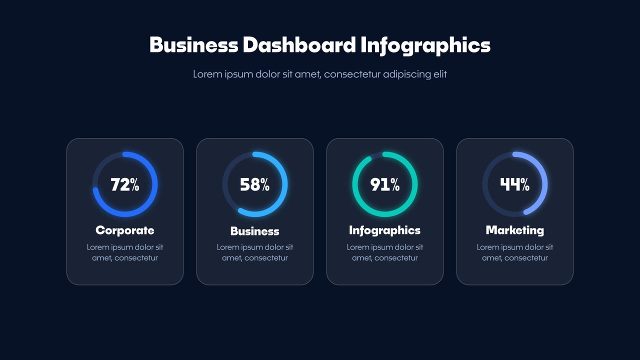
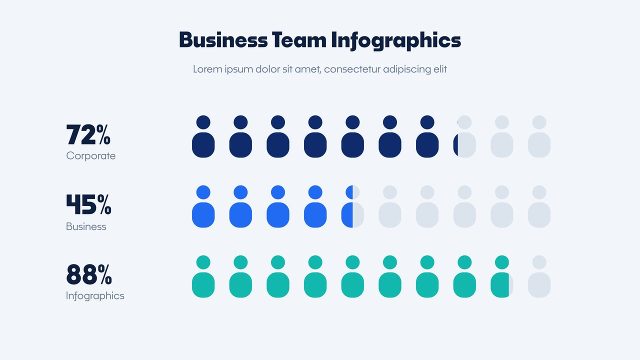
Corporate Year by Year Bar Chart Infographic Animation with Three Series is an animated business chart for Premiere Pro. Seven columns, three switchable series and an editable maximum value make this Premiere Pro chart easy to fill with your own yearly numbers. The background can be switched off to place the column chart over your own footage or slides. Use these business infographics for finance videos, marketing reports, startup decks and YouTube explainers. Labels around the column chart use Noka Medium and the numbers use Noka Bold, both from Adobe Fonts.
The build-in of the column chart takes about 9 seconds, ending on the final values. In Premiere Pro, Properties > Templates gives you Global Scale and Position, the title and subtitle, a value and label for 7 items, 3 switchable data series and 3 on/off switches, 9 colour controls and a background on/off switch. Full HD at 60 fps and resizable, the MOGRT works in Premiere Pro 2023 and newer without After Effects. Every value counts up automatically from zero, which keeps the statistics engaging.