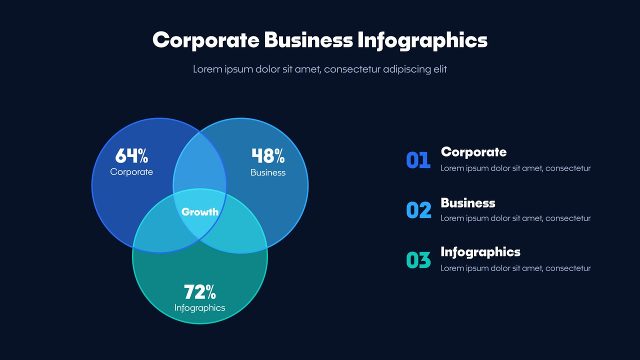
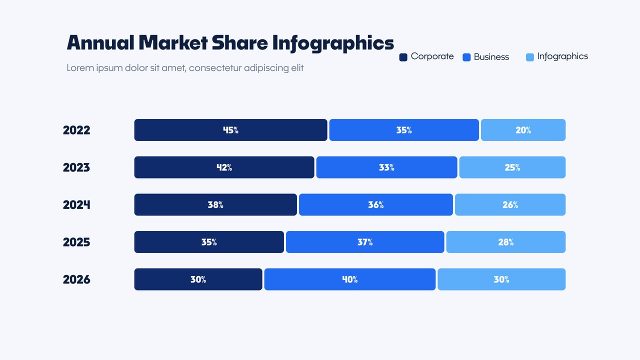
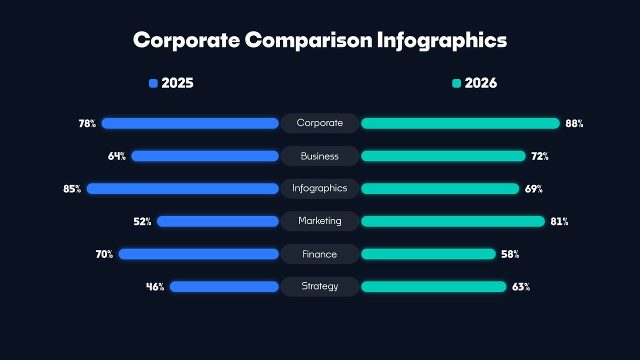
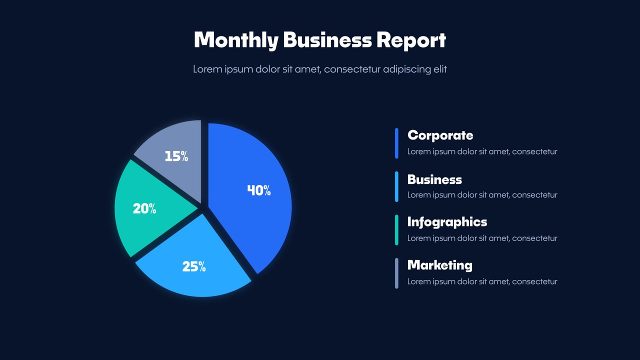
Corporate Scatter Chart Infographic Animation with Three Data Groups Premiere Pro MOGRT
Corporate Scatter Chart Infographic Animation with Three Data Groups: Premiere Pro infographic template with scatter plot, editable values and colours, 60 fps.
Attributes
- Application Premiere Pro
- Version Premiere Pro 2023 or later
- Resolution Horizontal · Resizable
- File size 0.21 MB
- Fonts Noka · Changeable
- Required plugins None
- Tutorial PDF included
- Video guide How to use MOGRT in Premiere Pro
- License Commercial use
About this template
Corporate Scatter Chart Infographic Animation with Three Data Groups is a data visualization template for Premiere Pro. Movable bubbles with size, X and Y controls make this Premiere Pro chart great for research, market positioning and data analysis. Every colour, including the scatter plot, can be changed to match your corporate brand. Use these business infographics for sales meetings, annual reports, social media posts and startup decks. Typography: Noka Bold and Medium (Adobe Fonts), chosen to keep the scatter plot clean and legible.
The animation runs about 9 seconds: the title and the scatter plot build in, the values count up and everything holds on screen. In Premiere Pro, Properties > Templates gives you Global Scale and Position, the title, a value and label for 7 items, 3 switchable data series and 7 on/off switches, 8 colour controls and a background on/off switch. This Premiere Pro 2023+ MOGRT runs at 60 fps in Full HD and keeps the scatter plot sharp at any size. Every value counts up automatically from zero, which keeps the statistics engaging.